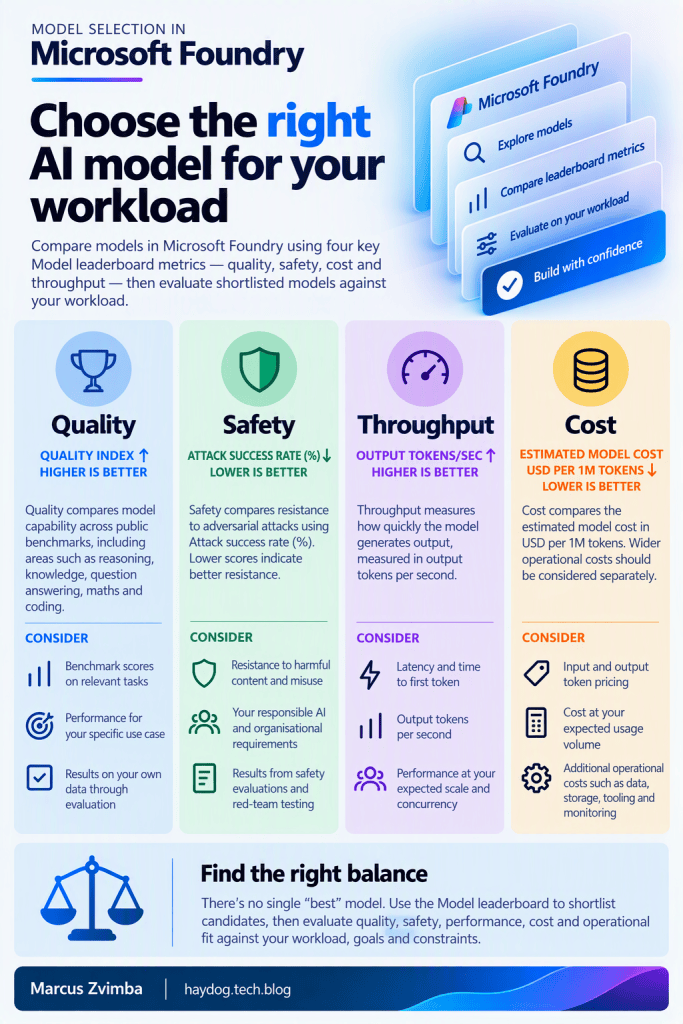

Quick, Sausage, Tomato, Cucumber – High, Low, High, Low | This is how I remember the four key metrics of Foundry model comparison:
✅ Quality – Quality index: higher is better
✅ Safety – Attack success rate (%): lower is better
✅ Throughput – Output tokens/sec: higher is better
✅ Cost – Estimated USD per 1M tokens: lower is better
Using Microsoft Foundry’s built-in model browser on the Discover > Models tab, you can compare these metrics. This is just the start of the process. Model evaluation is critical, testing the models performance doing the actual task.